
Choosing Commercial Complex Fountains in 2026 requires more than selecting an attractive centerpiece. A fountain must support visitor experience, water efficiency, safety, and long-term operating value. The United Nations World Water Development Report 2024 emphasizes growing pressure on freshwater resources and the need for responsible water management. That pressure changes the buying decision. A large basin may look impressive, but its refill rate, evaporation losses, filtration demand, and cleaning schedule deserve equal attention.
The U.S. Environmental Protection Agency recommends water-efficient practices, leak control, and performance monitoring across commercial properties. These principles apply directly to interactive and decorative fountains. Meanwhile, the International WELL Building Institute and LEED guidance continue to recognize thoughtful environmental design, occupant comfort, and responsible resource use. Their frameworks do not guarantee a successful fountain. Details still matter. Ask for pump efficiency data, chemical-control procedures, splash-risk assessments, and maintenance records. Check the nozzle pattern at walking level, not only in a glossy rendering. A quiet pump room can protect guest comfort, while correctly positioned drains can prevent slippery surfaces after peak hours.
There is no universal best model. A transit hub, hotel plaza, and shopping center face different traffic patterns and maintenance capabilities. This guide examines those differences, using practical design considerations and industry evidence. Some assumptions may fail on site, especially when climate, wind, or local water quality changes. That is why professional consultation, documented testing, and lifecycle-cost comparisons remain essential when choosing Commercial Complex Fountains for 2026.
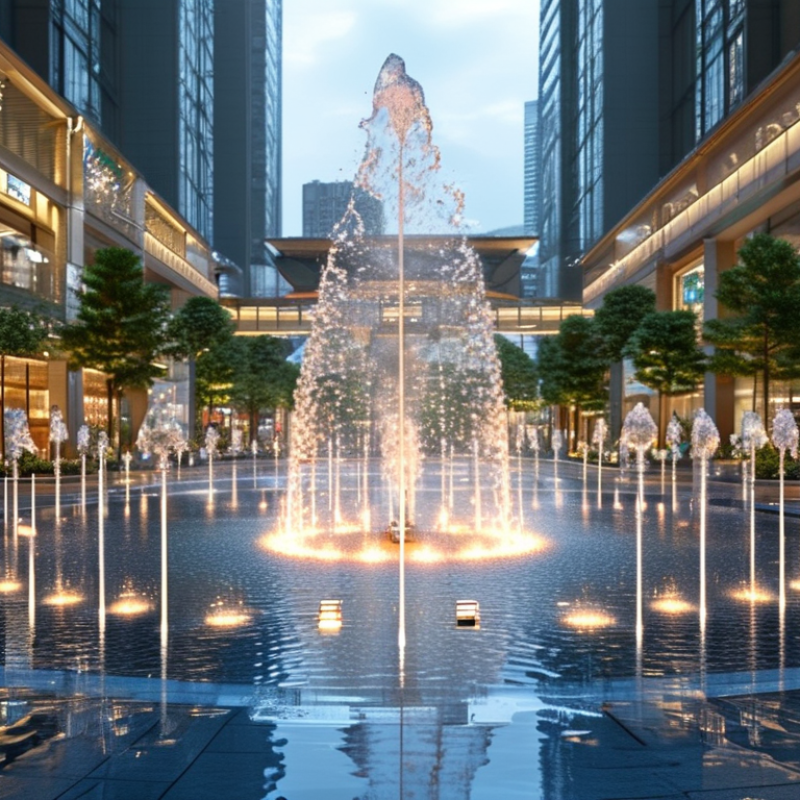
How to Choose Commercial Complex Fountains in 2026?
A fountain brief should begin with footfall, not appearance. Record hourly visitors for at least four representative weeks. Separate commuters, shoppers, families, and evening guests. A water feature near a food court needs different capacity from one beside a quiet entrance. JLL’s 2024 Global Consumer Experience Survey identifies dwell time, repeat visits, and physical engagement as important retail experience measures. Use these metrics before choosing height, sound, or lighting. A beautiful fountain can still fail during weekday mornings.
Budget planning must include more than installation. Allow for civil works, filtration, water treatment, lighting, electricity, cleaning, and seasonal shutdowns. Set a 2026 ROI dashboard with baseline footfall, average dwell time, nearby tenant sales, event bookings, social mentions, and maintenance cost per month. ICSC research reported an 8.4% increase in nearby home values around newly opened grocery stores, showing how physical destinations can create wider commercial value. The figure is not proof that every fountain pays back. It is a useful reminder to measure the surrounding ecosystem.
Tips: Compare a fountain zone with a similar control zone. Measure results for 90 days. Keep it honest. Ask whether the fountain increases visits or merely photographs well. Specify water-saving controls, safe access routes, and accessible viewing points in the brief. Review real maintenance records from comparable projects, not optimistic supplier estimates. A smaller feature with reliable operation may outperform a dramatic installation that stays switched off.
Define the brief around footfall, capital budget, and measurable commercial return.
Mid-scale interactive fountains generally provide the strongest balance between visitor uplift and capital efficiency. Larger landmark installations can create higher absolute footfall, but their longer payback period requires stronger leasing, advertising, or event revenue.
Planning benchmarks for 2026 commercial feasibility studies. Footfall uplift represents estimated annual visitor growth versus a comparable site without a new fountain. Three-year ROI is calculated from incremental operating income, tenant-support value, event revenue, and avoided replacement costs after the initial installation budget.
When choosing a commercial complex fountain, size the hydraulic system before judging its visual impact. Start with the basin’s usable volume, not its maximum architectural volume. Divide that volume by a 30–60-minute turnover target to estimate the recirculation flow.
For example, a 30,000-gallon basin needs about 500 gallons per minute for a 60-minute turnover. A 30-minute target requires roughly 1,000 gallons per minute.
Keep display flow separate. Jets, cascades, and spillways may demand much more water than filtration alone. Their combined peak-flow data should guide pump capacity, pipe diameter, surge-tank size, and electrical planning.
Peak demand appears during programmed sequences. It also rises when several features operate together. Request flow curves from equipment suppliers, then verify them with a qualified water-feature engineer. Field measurements matter. Pipe friction, elevation changes, clogged strainers, and wind can reduce actual performance. A fountain that looks adequate on paper may produce weak jets at opening time.
The first estimate is rarely perfect. I would leave practical capacity for maintenance and seasonal changes, but avoid excessive oversizing. An oversized pump can increase noise, energy use, and control difficulty. Record basin volume, desired turnover, maximum display flow, and operating schedules in one calculation sheet. Have an independent professional review it before construction. Small errors become expensive when concrete and underground pipes are already finished.
Safety should guide fountain selection from the first drawing. Apply ADA 2010 principles to accessible routes, controls, clear floor space, and edge transitions. A beautiful basin can still create barriers if visitors must cross a wet or narrow path. Keep control buttons reachable, with firm mounting and clear approach space. Confirm dimensions with a qualified accessibility professional.
EN 1717 helps engineers control drinking-water contamination risks. Specify suitable backflow prevention for makeup-water connections, cleaning systems, and chemical dosing equipment. Separate potable supplies from decorative water circuits. Include testable devices, isolation valves, and accessible service points. Local plumbing rules may add requirements, so engineers should verify the final design with the authority having jurisdiction.
Wet floors demand more than a “non-slip” label. Request documented slip-resistance testing for the actual tile, stone, grout, and surface finish. Test samples when wet, contaminated, and exposed to cleaning residues. Place drainage near splash zones, while avoiding abrupt level changes. One detail teams often underestimate is overspray during wind. It can reach ramps within minutes. The 1:12 accessibility slope is not a complete safety answer. Surface texture, handrails, lighting, maintenance, and seasonal conditions still matter. Our design assumptions should remain open to correction after site testing and mock-up review.
Audit Lifecycle Value: Compare Energy, Water, Maintenance, and 10-Year TCO
A commercial fountain should be evaluated as equipment, not decoration. Begin with measured operating conditions, including pump load, daily runtime, water capacity, and local climate. A 30-kilowatt pump operating 12 hours daily can consume more than 131,000 kilowatt-hours annually. Actual usage may differ. That is why site measurements matter.
Request a ten-year total cost of ownership model from every supplier. Include purchase, installation, electricity, water treatment, filter replacement, cleaning, labor, repairs, and planned component renewal. Compare seasonal water loss, not just basin capacity. Evaporation, splash-out, wind, and drainage can quietly increase operating costs. A recirculating system still needs makeup water.
Maintenance access deserves equal attention. Can technicians reach pumps without removing heavy stone panels? Are valves labeled? Can filtration components be replaced during low-traffic hours? These details affect labor costs and public disruption. Ask for service intervals, spare-part availability, failure records, and written energy assumptions. Be cautious with optimistic projections.
Use measured utility rates and conservative scenarios. Test the model with higher electricity prices, longer runtime, and one unplanned pump repair. The cheapest installation may become the most expensive asset by year six. Some assumptions will be imperfect. Document them, review them annually, and adjust the operating plan when real data disagrees.